TL;DR:
- Lead scoring automation ranks leads by likelihood to convert using rules or predictive models and automates routing actions. A hybrid approach combining rules and AI, along with proper data labeling and alignment, yields the best results for most teams. Continuous validation and retraining are essential to maintain accuracy as market behavior shifts.
Lead scoring automation uses rules and predictive models to assign a live score that ranks each lead by conversion probability, then triggers routing or nurture actions automatically. If you’re starting from scratch or fixing a broken system, three moves will get you the fastest traction:
- Audit your CRM first. Pull 200+ historical closed-won and closed-lost records and tag outcomes. Without labeled history, any model you build is guessing.
- Set a defensible MQL threshold. Aim for a moderate MQL rate and find the score decile where conversion meaningfully exceeds your baseline. Too tight and your SDRs starve; too loose and they ignore the queue.
- Pick your integration path. Native CRM scoring gets you live in days. A hybrid pipeline (rules baseline plus a predictive layer) takes longer but produces meaningfully higher accuracy once your data matures.
Table of Contents
- What lead scoring automation actually does for your pipeline
- How lead scoring automation works: five phases
- Rule-based vs. predictive vs. hybrid: which model fits your team?
- Which signals actually move your lead scores?
- Implementation checklist: from kickoff to live scoring
- How to measure whether your scoring system is working
- Common pitfalls that kill scoring projects
- What research says about hybrid models and alignment
- Key Takeaways
- The gap between what scoring promises and what actually ships
- Cannatract builds and runs your scoring system from audit to deployment
- Useful sources for deeper study
- FAQ
What lead scoring automation actually does for your pipeline
Manual lead scoring assigns points by hand, usually in a spreadsheet or a static CRM field. A rep or marketing manager decides that “VP title = 10 points” and “email open = 5 points,” and the system never questions those weights. Automated scoring replaces that static logic with a system that either applies rules consistently at scale or trains a model on historical outcomes and updates weights as new data arrives.
The practical difference is significant. Predictive models learn from historical closed-won and closed-lost records and weigh hundreds of signals automatically, surfacing patterns a human would never spot by scanning a spreadsheet. A rule-based system, by contrast, is transparent and fast to deploy but requires someone to maintain the logic as your market shifts.
Three approaches exist, and they are not mutually exclusive:
- Predictive (AI) scoring: — A machine learning model trained on labeled outcomes. Higher accuracy over time, but needs data volume and ongoing maintenance.
The business case for automating this process comes down to four concrete gains: SDRs spend time on leads that are actually likely to convert, marketing can suppress low-intent contacts from paid campaigns, sales cycles shorten when high-intent leads get called within the hour, and revenue operations gets a feedback loop that improves over time.
How lead scoring automation works: five phases
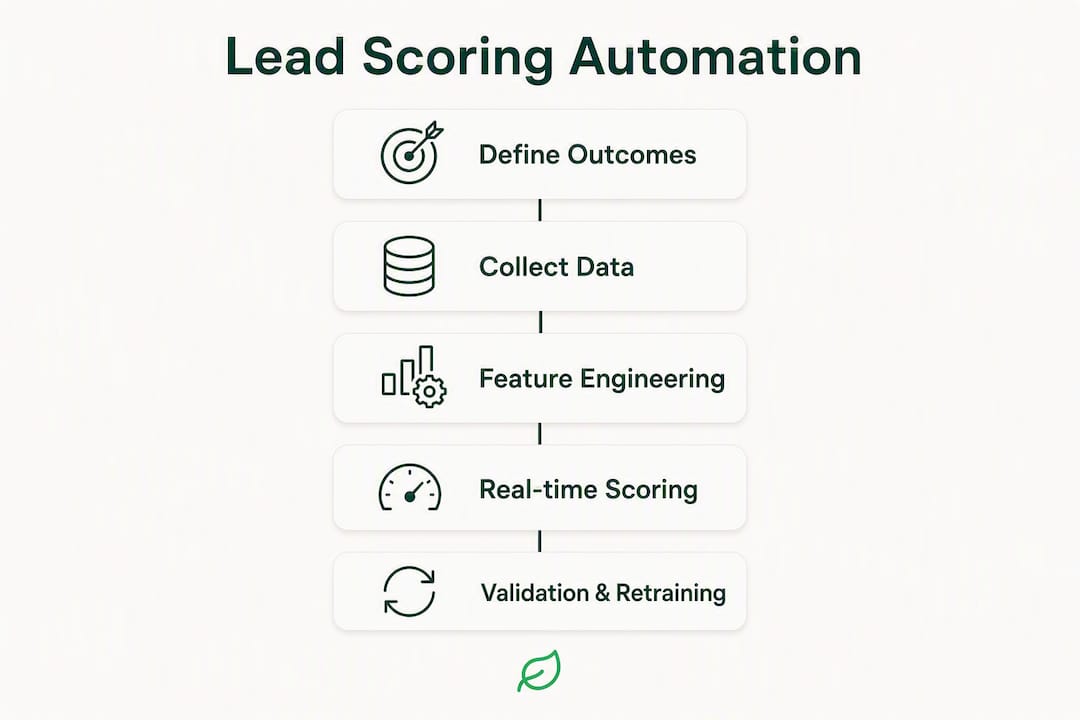
Every working system moves through the same five phases, regardless of whether you’re using a native CRM feature or a custom data pipeline.

Phase 1: Define outcomes and KPIs. Before touching data, sales and marketing must agree on what “converted” means. Is it a booked meeting, a created opportunity, or a closed deal? This definition becomes the label your model trains on.
Phase 2: Collect and clean data. Sources include your CRM, marketing automation platform (MAP), web analytics, product usage data, third-party intent feeds, and enrichment providers. Models combine firmographic, technographic, behavioral, and intent signals to predict conversion likelihood. Data quality at this stage determines everything downstream.
Phase 3: Feature engineering and modeling. For rule-based systems, this means translating business logic into point assignments. For predictive systems, it means transforming raw events into model features: recency, frequency, signal combinations, and decay functions.
Phase 4: Scoring and CRM integration. Scores must flow in real time to your CRM, MAP, dialer, and reporting systems. Integration complexity is a frequent blocker and often harder to solve than the modeling itself. Who owns this step matters: marketing ops handles the MAP side, sales ops owns CRM routing rules, and data engineering builds the pipeline if you’re going custom.
Phase 5: Validation and continuous retraining. A score that was accurate six months ago may not be accurate today. Monthly calibration checks and quarterly retraining keep the model honest.
Mini workflow example:
| Event | System action | CRM outcome |
|---|---|---|
| Pricing page visited twice in 7 days | Rule fires: +30 points | Score crosses MQL threshold |
| Demo request submitted | Model raises score to SQL tier | Lead routed to SDR queue |
| SDR notified | SLA: call within 1 hour | Opportunity created or lead recycled |
Rule-based vs. predictive vs. hybrid: which model fits your team?
Choosing the wrong approach wastes months. The right choice depends on your data maturity, team skills, and how quickly you need results.

| Dimension | Rule-based | Predictive (AI) | Hybrid |
|---|---|---|---|
| Accuracy | Moderate | High (with sufficient data) | High |
| Transparency | High | Low to moderate | High |
| Speed to value | Days | Weeks to months | Weeks |
| Data requirements | Low | 200+ converted leads, 6–12 months | Moderate |
| Maintenance overhead | Low (manual updates) | Moderate (retraining) | Moderate |
| Best for | Early-stage, small data | High-volume, data-mature teams | Most mid-market teams |
Decision checklist — ask these four questions before committing:
- Do you have at least 200 labeled converted leads and 6–12 months of outcome history? If not, start with rules and a hybrid ramp.
- Does your sales team need to understand why a lead is scored high? If yes, pure predictive scoring will create friction.
- Do you have a data engineer or RevOps analyst who can maintain a custom pipeline? If not, native CRM scoring is the faster, lower-risk path.
- How fast does your market move? Fast-moving cycles need shorter behavior windows and more frequent retraining.
For most mid-market B2B teams, a hybrid approach is the practical answer. Rules handle the obvious disqualifiers and hard gates; the model handles the nuanced signal combinations that rules would miss.
Which signals actually move your lead scores?
Not all signals are equal. Behavioral signals like pricing-page visits, demo requests, and product usage carry far higher predictive weight than volume-only metrics like email opens. Here’s how to rank and transform the signals that matter most:
High-impact signals (ranked by typical predictive weight):
- Demo request or contact form submission
- Pricing page visit (especially repeat visits within a short window)
- Active product usage or free trial engagement
- Repeat site visits within 7–14 days
- Job title match (decision-maker or economic buyer)
- Company size and industry fit (firmographic match)
- Third-party intent data (in-market research signals)
- Technographic fit (uses complementary or competing tools)
- Email reply or direct response to outreach
- Content downloads tied to bottom-of-funnel topics
Example feature transformations:
- 2 pricing page visits in 7 days = +30 points (recency + frequency rule)
- Demo request = immediate SQL flag, bypass MQL queue
- Unsubscribe or competitor content engagement = negative score, suppress from SDR queue
- Job title is “intern” or “student” = disqualify regardless of behavioral score
Pro Tip: Keep behavior windows short: 7–30 days for fast-moving sales cycles, up to 90 days for enterprise deals. Stale engagement data inflates scores for leads that went cold months ago. Also, prefer hashed or enriched keys over raw email addresses when joining behavioral data to firmographic records — it reduces identity resolution errors and keeps you on the right side of data privacy requirements.
Implementation checklist: from kickoff to live scoring
Follow these steps in order. Skipping alignment or validation is the single most common reason scoring projects fail.
- Align sales and marketing on the MQL definition. Get written agreement on what score threshold triggers an MQL, what SLA sales commits to (aim for a call within 1 hour for high-tier leads), and what happens when a lead is rejected.
- Extract and label historical records. Pull at least 200 closed-won and 200 closed-lost records from your CRM. Tag outcomes, clean duplicates, and remove records with missing firmographic data.
- Run a backtest. Apply your proposed rules or train a preliminary model on 70% of the labeled data. Test on the remaining 30% and check whether the top decile converts at 2× or more the baseline rate.
- Choose your tools. Native CRM predictive scoring can be enabled in days; custom pipelines take weeks to months. Match the tool to your data maturity and team capacity. For CRM platform selection, the HubSpot vs. Salesforce comparison is worth reviewing before committing.
- Build data pipelines. Connect CRM, MAP, web analytics, and enrichment sources. Define refresh cadence (real-time for behavioral signals, daily for firmographic updates).
- Map scores to routing rules and SLAs. High-tier leads (e.g., score ≥ 80) route to SDR immediately. Mid-tier leads enter a nurture sequence. Low-tier leads get suppressed from paid retargeting.
- Test in shadow mode. Run the automated system in parallel with your existing process for 2–4 weeks. Compare which leads the model flags versus what sales actually works.
- Deploy and monitor. Go live, then check calibration weekly for the first month.
- Retrain quarterly. Or sooner if you launch a new product, enter a new market, or see a sudden drop in acceptance rates.
Training minimum: Predictive models typically need roughly 200 converted leads and 6–12 months of labeled outcome history to produce scores that meaningfully separate high- and low-intent leads. If you’re below that threshold, a hybrid ramp (rules now, model layer added later) is the right call.
| Acceptance criterion | Target |
|---|---|
| Top-decile conversion lift | ≥ 2× baseline conversion rate |
| MQL rate | 10%–30% of total leads |
| SDR SLA (high-tier leads) | Call within 1 hour |
| False-positive rate | Track and review monthly |
How to measure whether your scoring system is working
A scoring system that no one can prove is working will get abandoned. These are the KPIs and validation methods that give you a defensible answer.
Primary KPIs to track:
- Lead-to-opportunity rate by score tier (top tier should outperform bottom tier by a clear margin)
- MQL-to-SQL acceptance rate (sales accepting the leads marketing sends; below 50% is a warning sign)
- Lead velocity (are high-scoring leads moving through the funnel faster than before?)
- SDR reach rate on high-tier leads (are they actually being called within SLA?)
- Conversion lift in top deciles versus the population baseline
- Average deal size for leads sourced through automated scoring versus unscored leads
Validation methods:
- Holdout test: Hold out 20% of leads from the scoring system and route them manually. Compare conversion rates after 60–90 days.
- A/B routing experiment: Split high-scoring leads randomly between automated routing and manual review. Measure opportunity creation rate.
- AUC and precision@topX: Standard model performance metrics. AUC above 0.70 is a reasonable baseline for a first model; precision in the top 10% of scored leads should be well above the population average.
- Calibration plots: Check whether a lead scored at 80 actually converts at roughly 80%. Miscalibrated models mislead reps.
Monthly calibration checks with quarterly retraining keep the model aligned with current market behavior. Retrain sooner if you see a sudden drop in acceptance rates or a major shift in your ICP.
Common pitfalls that kill scoring projects
Most scoring failures are predictable. Here’s what goes wrong and how to stop it before it costs you a quarter.
The most common failure modes:
- Poor outcome labeling. If “closed-won” in your CRM includes trials that churned in 30 days, your model trains on noise. Audit your outcome definitions before you touch a model.
- Stale behavior windows. Counting a pricing-page visit from 6 months ago the same as one from last week inflates scores for cold leads. Use decay functions or time-bounded windows.
- Overfitting to a short season. A model trained on Q4 data may not generalize to Q1 buying patterns. Use at least 6–12 months of labeled history.
- Ignoring negative scoring. Negative scoring is as important as positive signals for keeping the pipeline clean. Unsubscribes, competitor content engagement, and bounce rates should subtract points or trigger suppression.
- Routing without SLA enforcement. A lead routed to an SDR queue that no one checks within 4 hours is worse than no routing at all. The score is only as good as the follow-up process it triggers.
Mitigations:
- Run a label audit before training. Check that closed-won records represent genuine revenue, not trial noise.
- Apply explicit negative scoring rules for disqualifying behaviors.
- Use holdout sets during validation to catch overfitting early.
- Set realistic MQL thresholds and get sales to sign off in writing.
- Require a sales acceptance test before declaring the system live.
Go/no-go red flags — pause the project if any of these are true:
- Fewer than 100 converted leads in your CRM history
- Fewer than 2 connected data sources (e.g., only CRM, no MAP or web data)
- No agreed SLA between sales and marketing
- No sales champion willing to co-own the scoring definition
What research says about hybrid models and alignment
The research consensus is clear: teams that move from gut-feel manual rules to predictive models eliminate bias toward high-volume, low-intent actions like email opens, and surface the signals that actually correlate with closed revenue. But pure predictive scoring without a rules layer creates a transparency problem. Sales reps distrust scores they can’t explain, and adoption collapses.
Scoring projects fail when marketing alone sets weights and thresholds. The fix is co-ownership: sales defines what “sales-ready” looks like in behavioral and firmographic terms, marketing operationalizes it, and both teams review acceptance rates monthly.
A typical before/after pattern looks like this: a team running manual rules sees a moderate MQL-to-SQL acceptance rate because marketing and sales have different mental models of a qualified lead. After aligning on a shared definition and deploying a hybrid model, acceptance rates improve significantly because the leads sales receives better match their criteria. The model didn’t do all the work; the alignment conversation did half of it.
Practitioners recommend hybrid systems that retain clear rule-based gates for transparency while allowing AI to handle complex signal combinations. This also makes the system easier to audit and adjust when your ICP shifts.
Pro Tip: Before building anything, run a 2-week data audit focused on three questions: Are your outcome labels clean? Are your behavioral data sources connected and refreshing on schedule? Do your current routing rules have an SLA attached? Answering those three questions surfaces the quick wins that a longer build would otherwise bury.
Key Takeaways
Lead scoring automation delivers the most value when you combine a rules baseline with a predictive layer, align sales and marketing on a shared MQL definition, and validate the system with holdout tests before going live.
| Point | Details |
|---|---|
| Hybrid approach wins | Combine rule-based gates with a predictive model for both transparency and accuracy. |
| Data minimums matter | You need a sufficient amount of converted leads and several months of history before a predictive model is reliable. |
| MQL threshold discipline | Target a 10%–30% MQL rate; find the score decile where conversion is at least 2× the baseline. |
| Measure and retrain | Run monthly calibration checks and retrain quarterly, or sooner after a major business shift. |
| Cannatract’s audit path | Cannatract’s free automation audit covers data readiness, score mapping, CRM routing, and SLA gaps in 2 weeks. |
The gap between what scoring promises and what actually ships
The most common mistake teams make with AI lead scoring is treating it as a software problem. They buy a tool, connect the CRM, and wait for the scores to improve pipeline. Six months later, the SDRs have stopped trusting the queue and marketing is back to sending everyone the same nurture sequence.
The tool was never the problem. The problem is almost always one of three things: outcome labels that don’t reflect real revenue, a scoring threshold that marketing set without sales input, or a routing rule with no SLA attached to it. A model trained on bad labels produces confident-looking scores that point in the wrong direction. A threshold set too low floods the SDR queue until reps learn to ignore it. A routing rule without an SLA is just a notification that no one acts on.
What actually works is less exciting than the vendor demos suggest. You need clean labeled data, a shared definition of “qualified” that sales helped write, and a follow-up process that treats the score as a commitment, not a suggestion. The hybrid approach earns its reputation not because it’s technically superior in every case, but because it forces the transparency conversation. When a rep can see that a lead scored high because of two pricing-page visits and a job title match, they’re far more likely to call it within the hour than when the score comes from a black-box model they don’t understand.
The teams that get the most out of automated lead qualification are the ones that treat the first deployment as a calibration exercise, not a finished product. They run holdout tests, review acceptance rates monthly, and retrain when the market shifts. That discipline is harder to sell than a new platform, but it’s what separates a scoring system that improves over time from one that quietly degrades until someone turns it off.
Cannatract builds and runs your scoring system from audit to deployment
Fixing a broken scoring system or building one from scratch takes more than connecting a CRM to a scoring tool. The real work is in the data plumbing, the routing logic, and the SLA enforcement that most teams skip. Cannatract handles all of it: from the initial data audit through model configuration, CRM integration, and live routing rules, with a fixed quote and a 2–4 week delivery window.
The free automation audit covers exactly what the implementation checklist above requires: data readiness, outcome label quality, score-to-routing mapping, SLA gaps, and a short roadmap for hybrid deployment. You leave the audit with a prioritized list of quick wins and a scoped proposal, not a vague recommendation deck.
What to expect after the audit:
- A clear picture of where your current scoring or routing is leaking pipeline
- A fixed-price proposal scoped to your data maturity and CRM stack
- An implementation timeline (typically 2–8 weeks depending on integration complexity)
If you’re ready to stop guessing which leads are worth calling, book your free audit at cannatract.co or review Cannatract’s AI automation services to see what a full build looks like.
Useful sources for deeper study
These resources cover the methodology, tooling, and validation guidance referenced throughout this article:
- Lead Scoring Model and MQL Thresholds — Fairview: — The most detailed practitioner guide on training minimums, MQL threshold-setting, and negative scoring rules. Required reading before you build a model.
- Dynamics 365 Lead Scoring Builder — Microsoft: Official documentation for native CRM scoring in Dynamics 365 Customer Insights; useful reference for teams already on the Microsoft stack.
- Customer Journey Automation Guide — Cannatract: Strategy guidance on how lead scores should feed into broader journey orchestration and automated follow-up sequences.
- Pipeline Automation Patterns — Pluck Talent: A useful external primer on multi-layer pipeline architectures that maps cleanly onto the data ingestion and routing phases of a scoring build.
FAQ
What is lead scoring automation?
Lead scoring automation uses rules, predictive models, or a combination of both to assign a live numeric score to each lead based on their attributes and behaviors, then triggers CRM actions like routing, nurture enrollment, or suppression automatically.
How many leads do you need before predictive scoring is reliable?
Practitioner guidance points to roughly 200 converted leads and 6–12 months of labeled outcome history as the minimum for a model that meaningfully separates high- and low-intent leads. Below that threshold, a hybrid rules-first approach is more reliable.
What is a good MQL threshold for automated lead scoring?
Target a 10%–30% MQL rate. Find the score decile where conversion is at least 2× your baseline rate and use that as your threshold. Too high and SDRs get too few leads; too low and they stop trusting the queue.
What is the difference between rule-based and AI lead scoring?
Rule-based scoring assigns fixed point values to predefined attributes and actions; it’s fast to deploy and easy to explain. AI lead scoring trains a model on historical outcomes and weights signals automatically, producing higher accuracy at scale but requiring more data and maintenance.
How can Cannatract help with lead scoring automation?
Cannatract designs and builds custom AI-driven scoring and routing systems, including CRM integrations, data pipelines, and SLA enforcement logic. The process starts with a free automation audit that identifies data readiness gaps and routing inefficiencies before any build begins.